Data Publication Module
The Data Publication module enables you to share real-time IoT data through interactive, visually engaging outputs such as charts, maps, and tables — customizable to match any audience or use case.
This functionality allows real-time monitoring and sharing of crucial information with stakeholders, partners, or the public.
With support for a wide range of formats and visualization tools, you can publish meaningful insights across domains like smart parking, lighting, energy, mobility, or environment — while maintaining full control over what is shown, to whom, and how.
Customizable Data Outputs
Design data views to match your specific needs. Adjust layout, content structure, color schemes, and component behavior to fit different use cases — from operational dashboards for internal monitoring, to simplified public views focused on key metrics. Data can be visualized by category, region, or timeframe, with support for filtering, comparison, and time-based segmentation.
Interactive Data Visualization
Publish IoT data through fully interactive visual components — including real-time graphs, geospatial maps, and data tables that update automatically as new data flows in. This gives users immediate access to live information and helps identify trends, anomalies, or system status at a glance. The module supports the integration of complex datasets, including KPIs and telemetry, making your outputs not only informative but also actionable.
Data Sharing & Embedding
Easily publish your visualized data on external websites, city portals, or partner platforms using secure embed codes or iFrame integration. Whether you're displaying parking availability for citizens, publishing energy consumption dashboards for stakeholders, or sharing environmental data with researchers, this module ensures controlled, yet open, data dissemination — fully aligned with smart city transparency goals.
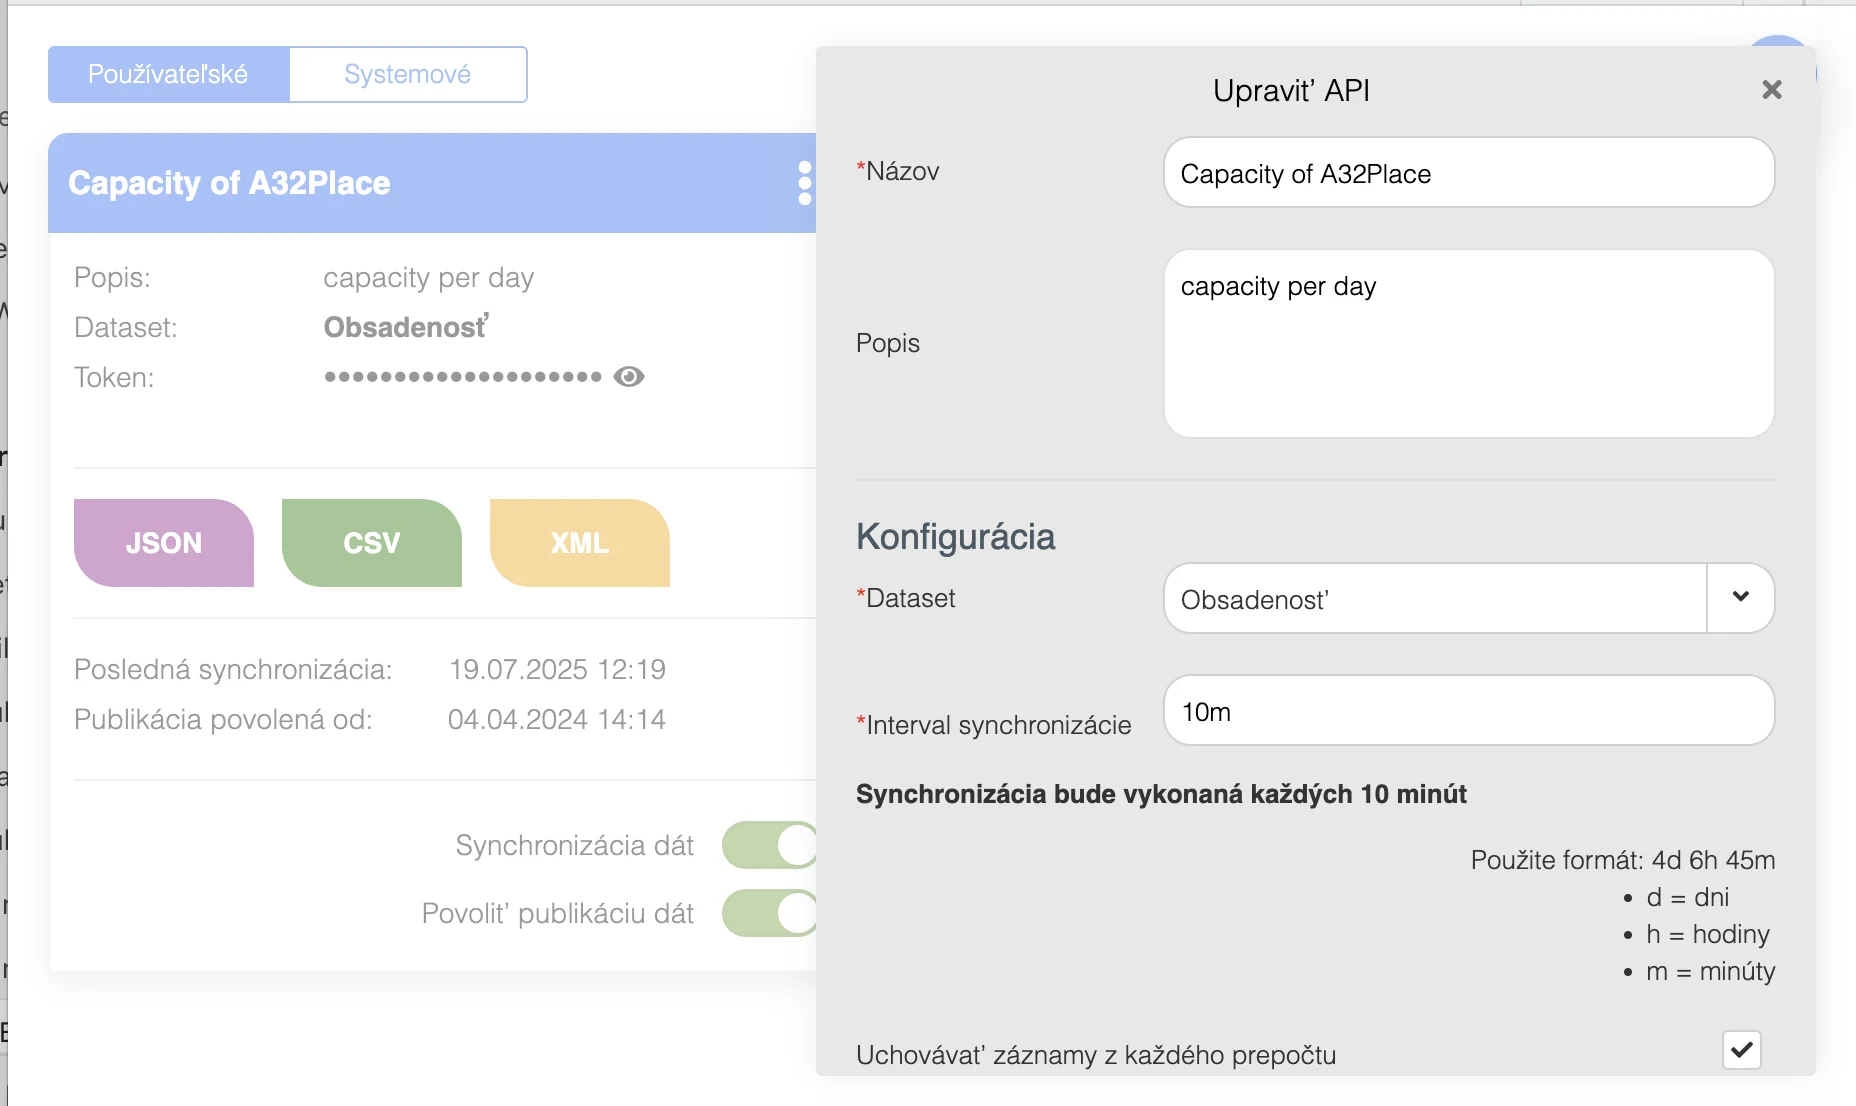
Flexible Data Control
You retain full control over what gets published, to whom, and under which rules. Manage visibility settings, define data access by user role, department, or partner organization, and respect data privacy obligations. You can also prepare different views for different audiences — for example, public-facing simplified views and detailed internal analytical dashboards — all from the same source.